
Documentation
-
Momentum
-
MLOps
-
Impulse EDW
-
- 2.1 Create a Warehouse
- 2.2 Edit Warehouse
- 2.3 Datasources In Warehouse
- 2.4 Ingesting Data Into Tables or Datasources
- 2.4.1 Ingesting From Momentum Data Pipeline
- 2.4.2 Uploading File Using Impulse UI
- 2.4.3 Ingesting From External File/Storage System
- 2.5 Add Data to Existing Tables
- 2.5.1 Update Existing Index
- 2.6 Delete Table Records (Rows)
- 2.7 Delete Tables or Datasources
- 2.8 Monitoring Indexing Tasks
- 2.9 View Datasource Stats
-
Inset BI
- Alerts and Reports
- Connecting to a new database
- Registering a new table
- Creating charts in Explore view
- Manage access to Dashboards
-
- Articles coming soon
-
- Articles coming soon
-
- Articles coming soon
-
- Articles coming soon
-
- Articles coming soon
-
APIs
- Articles coming soon
< All Topics
Print
2.9 View Datasource Stats
The partition stats shows the number of partitions created for a selected datasource. Here are the steps to visualize the partition stats:
- Main navigation menu –> click Data Warehouses. This will shows a list of warehouses
- Click on the Datasources link corresponding to a warehouse. This will show all datasources within a warehouse.
- Corresponding to a datasource (or table name), click on the “Stats” icon (as shown in Figure 2.7a below).
- The Stats screen shows the following three types of information (also see Figure 2.7b below):
- Partition Count: The bar chart shows the number of partitions created over time. The x-axis shows the ingestion date and the y-axis shows the number of partitions created.
- Partition Size: The line chart shows the size of partitions over time. The x-axis is the ingested time and y-axis is the partition size in Bytes.
- Partition Details: A tabular view of partition details containing the partition version, partition number, creation date and partition start and end intervals.

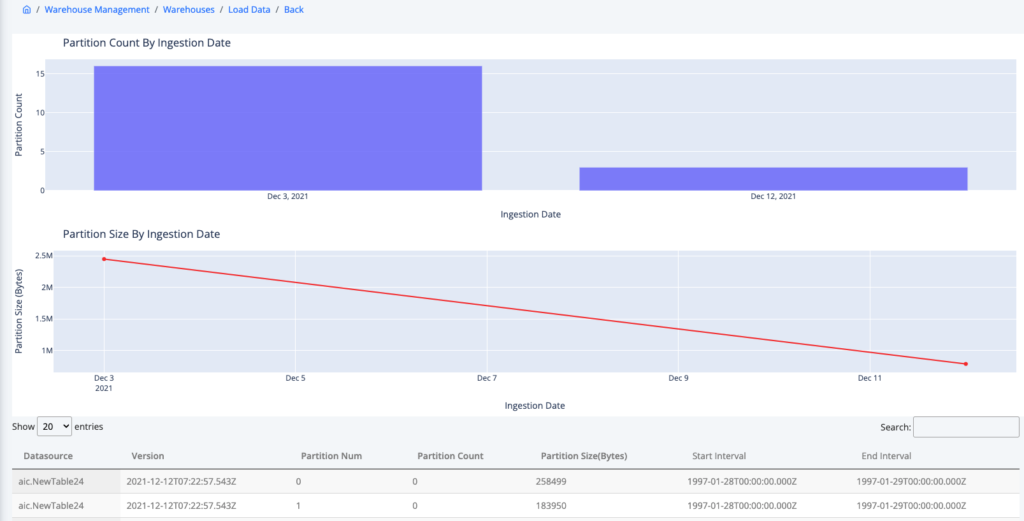
Table of Contents