Documentation
-
Momentum
-
MLOps
-
Impulse EDW
-
- 2.1 Create a Warehouse
- 2.2 Edit Warehouse
- 2.3 Datasources In Warehouse
- 2.4 Ingesting Data Into Tables or Datasources
- 2.4.1 Ingesting From Momentum Data Pipeline
- 2.4.2 Uploading File Using Impulse UI
- 2.4.3 Ingesting From External File/Storage System
- 2.5 Add Data to Existing Tables
- 2.5.1 Update Existing Index
- 2.6 Delete Table Records (Rows)
- 2.7 Delete Tables or Datasources
- 2.8 Monitoring Indexing Tasks
- 2.9 View Datasource Stats
-
Inset BI
- Alerts and Reports
- Connecting to a new database
- Registering a new table
- Creating charts in Explore view
- Manage access to Dashboards
-
- Articles coming soon
-
- Articles coming soon
-
- Articles coming soon
-
- Articles coming soon
-
- Articles coming soon
-
APIs
- Articles coming soon
< All Topics
Print
3.4 Monitoring ML Training
Machine learning model training is a compute-intensive and time-consuming process. There are a few ways to monitor the training progress.
- Click on ML Model located at the top menu bar or refresh your browser to see the current running status. While the model is running, it will show a spinner indicating the model is learning.
- Click “Logs” to see the runtime log – both stdout and stderr logs are displayed in a separate page.
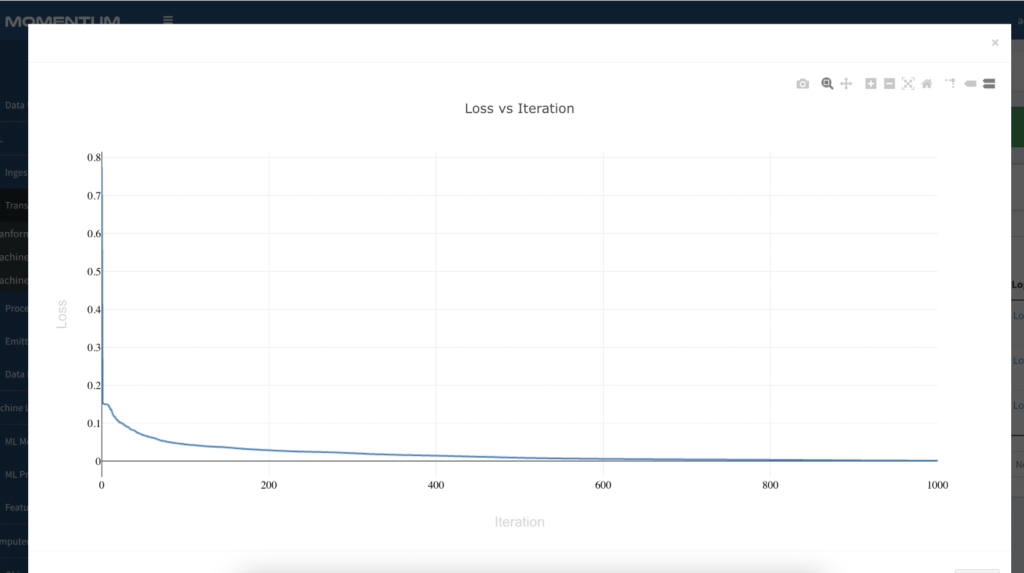
- After the model is trained (and in some cases, while the model is learning), click the graph icon to show the “Model Score” curve. For the MLPC model, the curve shows a plot of model loss vs iterations. Figure 3.3 shows an example loss graph.

Figure 3.3: Loss vs iteration graph.
- Click “View Model” to see the model metrics after the training is completed (Figure 3.4 for example)

Figure 3.4: Model metrics
Table of Contents